SQL Problem Solving: Writing Queries
Concept. Most queries you write are one of five shapes: filter to a subset, rank within groups, accumulate over time, compare to a group, or flag outliers.
Intuition. Recognize the shape, then fill in your own tables. "Top 3 songs per genre" is a ranking; "users who played but never shared" is a set difference. The five patterns below give each shape a skeleton.
Master These 5 Patterns
These five patterns cover the most common query shapes you will write. Each one below uses a small illustrative schema, just the tables it needs, so the shape stands on its own; swap in your own tables when you apply it.
-
The Funnel: find drop-offs (listened, but never shared).
-
The Ladder: rank items within groups (top songs per genre).
-
The Timeline: track cumulative behavior (running total of listens).
-
The Comparison: individual vs. group metrics (artist vs. genre average).
-
The Exception: spot outliers (viral surges in daily listening).
Pattern 1: The Funnel
Identifying user progression through stages, or the lack thereof.
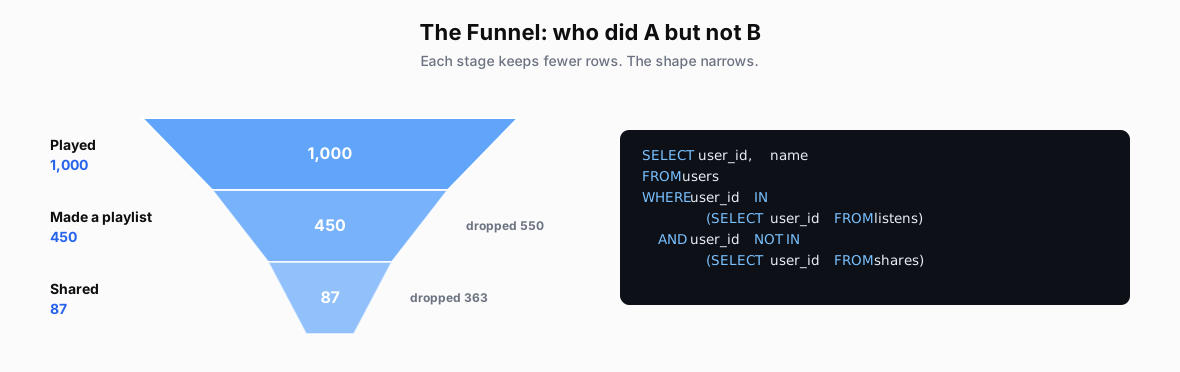
When to use: users who did A but never B · conversion-funnel analysis · multi-step journeys · drop-off analysis.
The funnel query
-- Users who played a song but never shared one
SELECT user_id, name
FROM users
WHERE user_id IN     (SELECT user_id FROM listens)   -- played
  AND user_id NOT IN (SELECT user_id FROM shares)    -- but never shared
Pattern 2: The Ladder
Ranking items within groups.
<img src="svgs/writing-ladder.svg" style="width:100%;height:auto;display:block;" alt="A ladder of Pop songs numbered by plays: ranks 1 to 3 kept on the top rungs, rank 4 cut below the line, via ROW_NUMBER() OVER (PARTITION BY genre ORDER BY plays DESC) with rn <= 3.">
When to use: top 3 items per category · rank within departments · find the nth best · percentile rankings.
The ladder query
-- Top 3 songs per genre
SELECT * FROM (
  SELECT song, genre, plays,
    ROW_NUMBER() OVER (
      PARTITION BY genre        -- restart numbering for each genre
      ORDER BY plays DESC       -- highest plays gets #1
    ) AS rn
  FROM songs
) ranked
WHERE rn <= 3                   -- keep the top 3 rungs
Pattern 3: The Timeline
Cumulative and moving calculations.
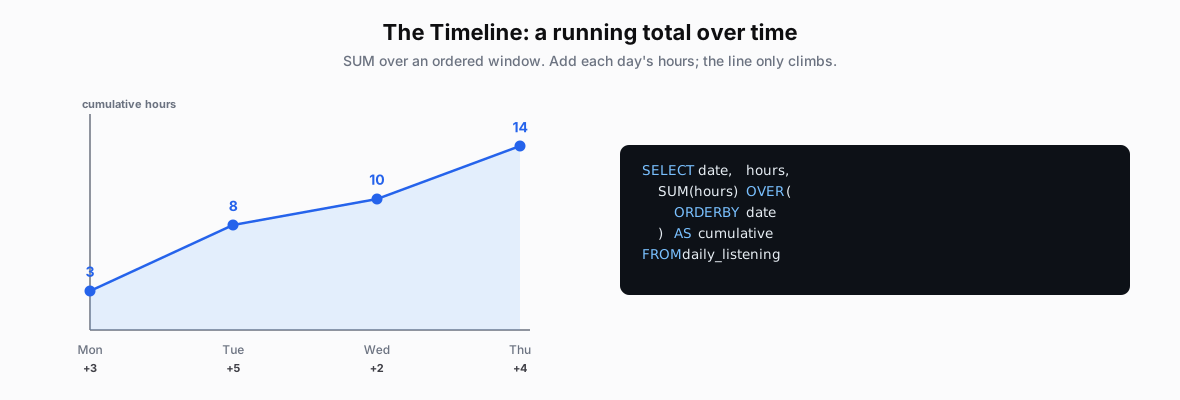
When to use: running total over time · moving averages · month-to-date · cumulative growth.
The timeline query
-- Running total of daily listening hours
SELECT date, hours,
  SUM(hours) OVER (
    ORDER BY date               -- accumulate in date order
  ) AS cumulative_hours         -- 3, then 3+5=8, then 8+2=10 ...
FROM daily_listening
Pattern 4: The Comparison
Individual vs. group performance.
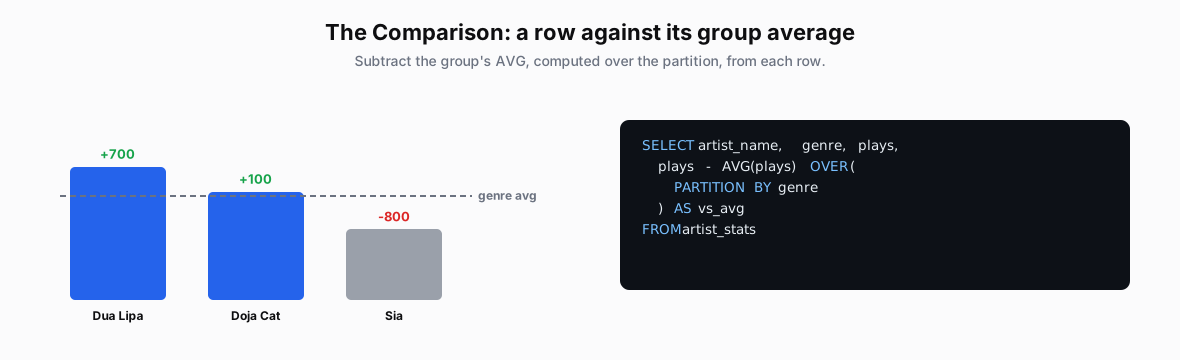
When to use: compare to a group average · percentile within a group · above/below a benchmark · peer comparisons.
The comparison query
-- Each artist's plays vs. their genre average
SELECT artist_name, genre, plays,
  plays - AVG(plays) OVER (
    PARTITION BY genre          -- average within each genre
  ) AS vs_avg                   -- positive = above peers, negative = below
FROM artist_stats
Pattern 5: The Exception
Spotting outliers and anomalies.
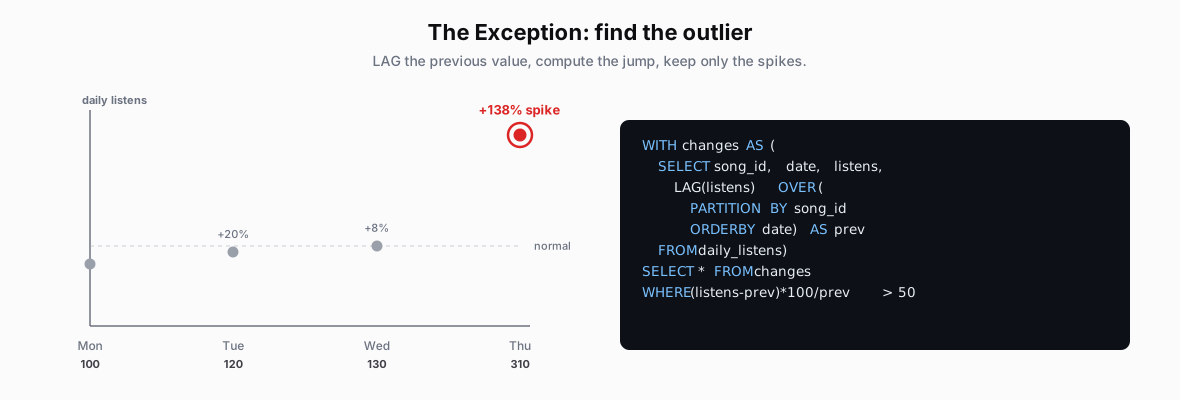
When to use: sudden drops · unusual spikes · behavior changes · anomaly detection.
The exception query
-- Daily listen spikes over 50%
WITH changes AS (
  SELECT song_id, date, listens,
    LAG(listens) OVER (PARTITION BY song_id ORDER BY date) AS prev_listens
  FROM daily_listens
),
with_pct AS (
  SELECT *,
    (listens - prev_listens) * 100.0 / NULLIF(prev_listens, 0) AS pct_change
  FROM changes
)
SELECT * FROM with_pct
WHERE pct_change > 50            -- keep only the surges
Example 1: Breakout Artists
Problem: identify breakout artists with over 50% month-over-month growth in the last 3 months. Patterns used: Timeline (LAG for the previous month) and Comparison (the percent change).
Step 1: Count monthly plays. Establish a baseline: count plays for each artist per month.
WITH monthly_plays AS (
  SELECT
    artist_id,
    DATE_TRUNC('month', play_date) AS month,   -- round to the month
    COUNT(*) AS play_count
  FROM listens
  GROUP BY artist_id, month                     -- one row per artist-month
)
-- artist_id | month   | play_count
-- 1234      | 2024-09 | 1000        (Sept baseline)
-- 1234      | 2024-10 | 1600        (Oct growth)
-- 1234      | 2024-11 | 2500        (Nov spike)
Step 2: Calculate the growth rate. Compare each month to the previous one with LAG().
, artist_growth AS (
  SELECT
    artist_id, month, play_count,
    LAG(play_count) OVER (
      PARTITION BY artist_id        -- reset per artist
      ORDER BY month                -- in time order
    ) AS prev_month_plays,
    ROUND(
      (play_count - LAG(play_count) OVER (PARTITION BY artist_id ORDER BY month))
      * 100.0 / NULLIF(LAG(play_count) OVER (PARTITION BY artist_id ORDER BY month), 0),
      1
    ) AS growth_pct
  FROM monthly_plays
)
-- artist_id | month   | play_count | prev | growth_pct
-- 1234      | 2024-09 | 1000       | NULL | NULL      (no prior month)
-- 1234      | 2024-10 | 1600       | 1000 | 60.0      (+60%)
-- 1234      | 2024-11 | 2500       | 1600 | 56.3      (+56%)
Step 3: Find the breakout artists. Filter to over 50% growth in the last 3 months.
SELECT a.name AS artist_name, g.month, g.play_count, g.growth_pct
FROM artist_growth g
JOIN artists a ON g.artist_id = a.artist_id
WHERE g.growth_pct > 50                                        -- the breakout filter
  AND g.month >= DATE_TRUNC('month', CURRENT_DATE) - INTERVAL '3 months'
ORDER BY g.growth_pct DESC, g.month DESC

-- artist_name | month   | play_count | growth_pct
-- Dua Lipa    | 2024-10 | 1600       | 60.0        (+60% on Sept, artist 1234 above)
-- Dua Lipa    | 2024-11 | 2500       | 56.3        (+56% on Oct)