Problems: IO Cost Model
Reference and Setup
For the official formulas and notation, check the IO Cost Model.
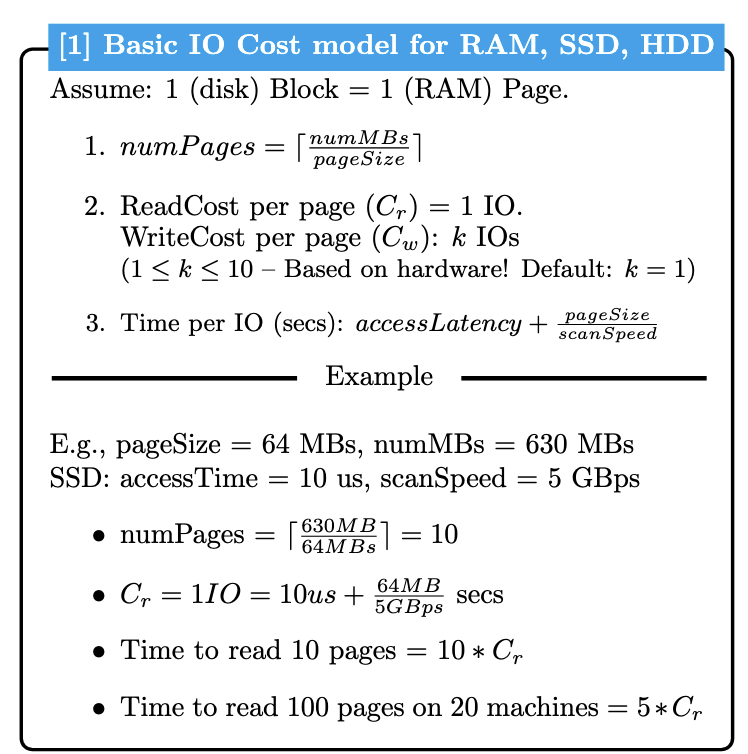
System Configuration:
- Page Size: 64 MB
- Spotify Songs Table: 500 million rows × 1024 bytes/row
- Device costs (C_r, C_w): the device table on the cheat sheet
Problem 1: Table Size Calculation
The Spotify Songs table has 500 million rows with an average row size of 1024 bytes. Calculate:
-
Total size in MB
-
Number of 64 MB pages needed
Show Solution
Total size
500,000,000 rows × 1024 bytes = 512,000 MB = 512 GB
Number of pages
512,000 MB ÷ 64 MB = 8,000 pages
Problem 2: Read Cost Comparison
Calculate the time (in seconds) to read 100 pages from different storage devices.
Show Solution
RAM
100 × (0.0000001 s + 0.00064 s) = 0.064 s
SSD
100 × (0.00001 s + 0.0128 s) = 1.281 s
HDD
100 × (0.01 s + 0.64 s) = 65 s (about 1,000× slower than RAM)
Problem 3: Cache Hit Rate Impact
Read 200 pages through a cache. RAM holds 90% of them. Of the pages RAM misses, 75% are on SSD and 25% on HDD. What is the total read time?
Show Solution
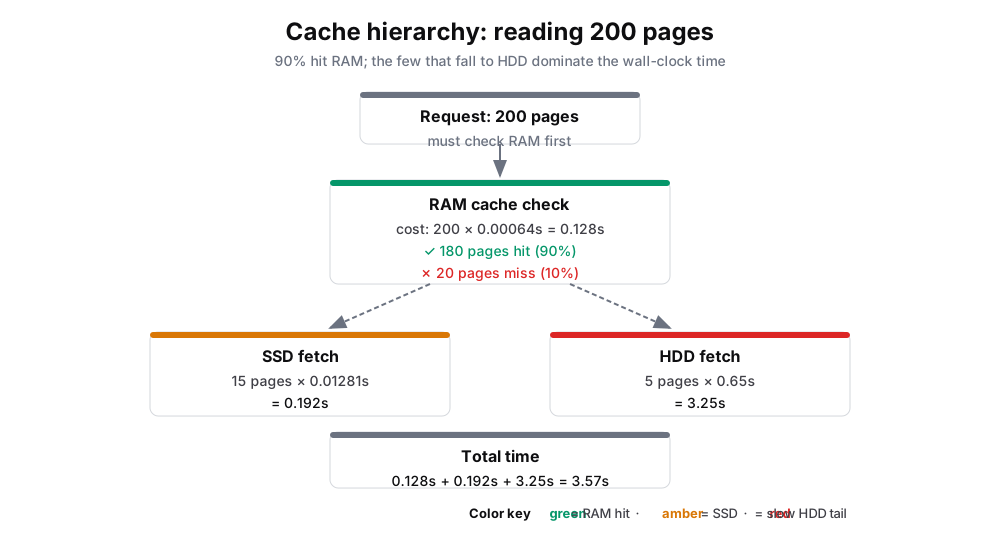 Figure: How a cached read works: 200 page readsHow a cached read works, for 200 page reads. Step 1: every read checks RAM first, hit or miss, 200 times 0.00064 s, 0.128 s. Step 2: 180 reads (90%) hit and are served from RAM; 20 (10%) miss and go to the next tier. Step 3: of the misses, 15 come from SSD at 0.01281 s each, 0.192 s, and 5 from HDD at 0.65 s each, 3.25 s, shown in orange. Total 3.57 s: the 5 HDD reads are 2.5% of the requests and 91% of the time.
Figure 1. Every read pays the RAM check (0.128 s); 180 stop there. The 20 misses split into 15 SSD fetches (0.192 s) and 5 HDD fetches (3.25 s), for 3.57 s in total. The 5 HDD reads are 2.5% of the requests and 91% of the time (3.25 / 3.57).
Total time: 3.57 s. The RAM check is paid on every read, and the few reads that fall to HDD dominate.
Problem 4: Mixed Read/Write Operations
You need to:
-
Read 30 pages
-
Write 10 pages
Calculate total cost for each storage device.
Show Solution
Cost formula
Total = 30 × CR + 10 × CW
Reads and writes cost the same on these devices, so this is 40 × CR.
RAM
40 × 0.00064 s = 0.026 s
SSD
40 × 0.01281 s = 0.512 s
HDD
40 × 0.65 s = 26 s
Problem 5: Network vs Local Storage
Compare reading 1 page from:
-
Local RAM
-
Local SSD
-
Local HDD
-
Network RAM (RAM on another machine)
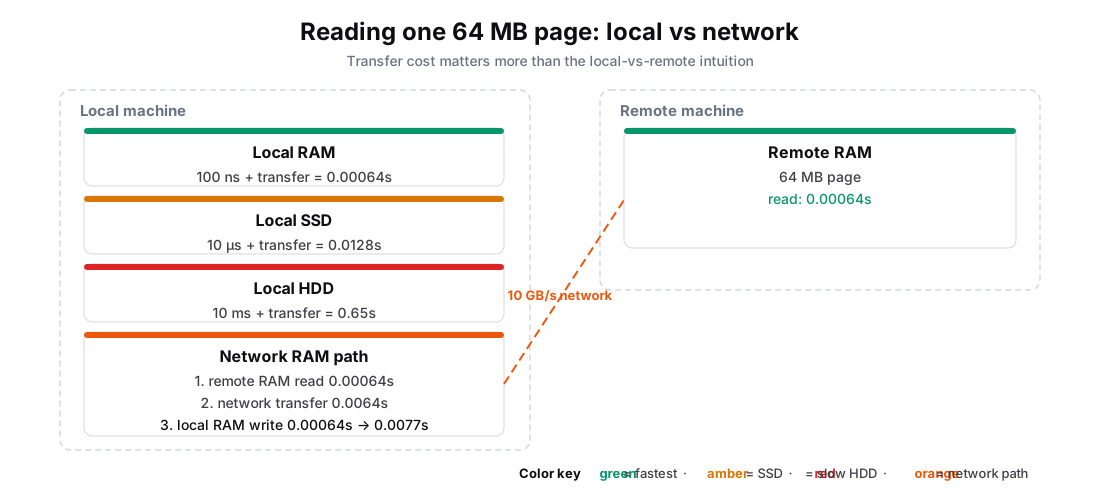 Figure: Network RAM: fetching a 64 MB page from another machineA Network RAM read of one 64 MB page. The page sits in RAM on a remote machine. You request it, the remote machine reads it from its RAM (0.00064 s), it travels back over a 10 GB/s network (0.0064 s, the orange arrow and the dominant cost), and you write it into your own RAM (0.00064 s), for 0.0077 s total, which still beats a local SSD read at 0.0128 s. Color key: orange the network hop, grey the machines and RAM.
Figure 2. A Network RAM read. The page sits in RAM on a remote machine; you request it, read it from remote RAM, send it back, and write it into your RAM. The network hop (0.0064 s) dwarfs the two RAM touches (0.00064 s each). Total 0.0077 s, still under a local SSD read (0.0128 s).
Show Solution
Network RAM
Remote read 0.00064 s + network hop 0.0064 s + local write 0.00064 s = 0.0077 s. The network hop (64 MB ÷ 10 GB/s) dominates.
Versus local storage
The single-page costs on the local devices are the same ones from Problem 2: RAM 0.00064 s, SSD 0.0128 s, HDD 0.65 s.
Ranked: Local RAM < Network RAM (0.0077 s) < Local SSD (0.0128 s) < Local HDD (0.65 s).
Key Takeaways
-
HDDs and SSDs are much slower than RAM for random access
-
Cache hit rates matter enormously - even 5% HDD access can dominate
-
Network RAM ≈ Local SSD in performance
-
Page size affects random access penalty - larger pages amortize seek cost
-
Moving forward: We'll count IOs (1 page = 1 IO) to analyze algorithm complexity