Case Study 3.1: BigQuery, From Web Crawl to Petabyte Analytics
Concept. BigQuery scales to trillions of rows by storing data in a columnar format and decoupling storage from compute. A query starts thousands of workers on demand and reads only the columns it touches.
Intuition. Imagine each music-rating row carries a 4-byte rating, a genre code, 5 MB of song audio, and 1 MB of artwork. To compute average rating per genre, with columnar storage we only need to read the tiny rating and genre columns. There is no reason to read media. The song alone is 1,250,000× larger than the rating. Workers split the selected-column scan and combine their results.
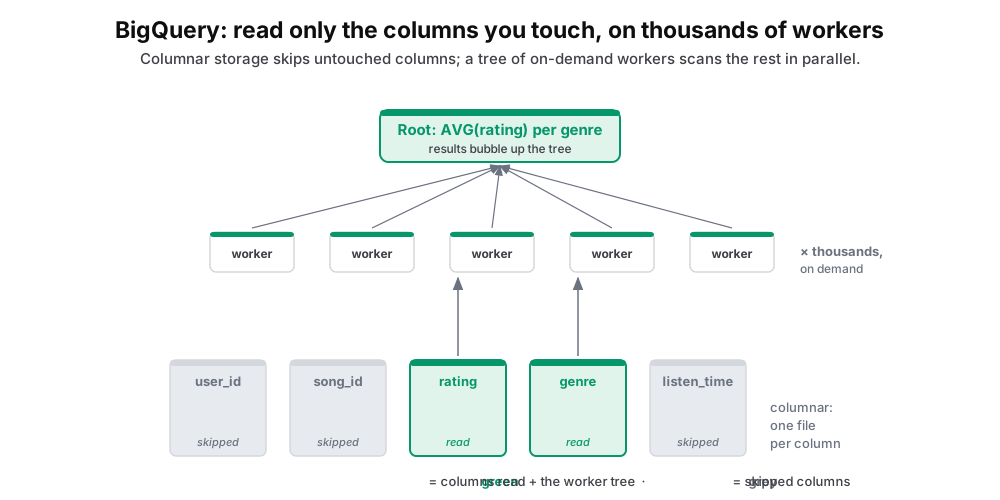 Figure: BigQuery: columnar storage scanned by thousands of on-demand workers on a treeIllustrative rows contain rating (4 bytes), genre (a 4-byte dictionary code), artwork (1 MB), and song audio (5 MB). The query reads rating and genre and skips both media payloads. Thin green bars mark on-disk columns. Workers scan the selected columns and aggregate results up a tree.
Figure 1. Each row in this illustrative table has a 4-byte rating, a 4-byte genre dictionary code, 1 MB of artwork, and 5 MB of song audio. The query reads the two small columns and skips the media. Workers scan those columns in parallel and combine partial results. Thin green bars identify on-disk columns.
Dremel begins with a foosball problem
In 2005, Google engineer Andrey Gubarev needed answers from Google's web datasets. Existing queries ran for hours and cut into his foosball time, so he investigated the bottlenecks. That work helped produce Dremel, the execution system that later became the foundation of BigQuery.
Row storage reads fields the query does not need
Google's web document storage held data points like:
-
URL
-
Title
-
Date
-
Keywords
-
Body (HTML). The heavyweight, often megabytes per row.
In a row-oriented layout, pages containing Date also contain the other fields, including the much larger HTML body. A query that needs a few bytes of dates therefore reads pages filled with unrelated data. Across web-scale datasets, that extra I/O turns an aggregation into hours of work.
Dremel stores and scans columns separately
Dremel stores URL, Date, and Body values in separate columnar structures.
-
Targeted reads. A query by Date reads the Date column without reading the HTML Body.
-
Better compression. Similar values repeat within a column, giving compression algorithms more structure to remove.
-
Parallel execution. Thousands of workers scan column slices, and an execution tree combines their partial results.
Dremel could run aggregation queries over trillion-row tables in seconds.
A few bytes of ratings, megabytes of media
This example (for teaching) stores the media payloads inline in each row to make the size contrast visible. It is separate from the course's Listens schema.
SELECT genre, AVG(rating) AS avg_rating
FROM media_ratings
GROUP BY genre
ORDER BY avg_rating DESC;
| Column | Assumed bytes per row | Query reads it? |
|---|---|---|
rating |
4 bytes | Yes |
genre |
4-byte dictionary code | Yes |
artwork |
1 MB = 1,000,000 bytes | No |
song |
5 MB = 5,000,000 bytes | No |
The contrast: a 5 MB song is 1,250,000× the size of a 4-byte rating. The query needs only 8 bytes per row from the two selected columns and skips 6 MB of media per row.
In this example, we don't focus on compression and storage overhead, for simplicity. In this model, a full scan of inline row data reads 6,000,008 bytes per row; the selected column scan reads 8.
The Paper
BigQuery is built on Dremel, described in Google's 2010 VLDB paper. The paper reports interactive analysis of trillion-row tables using nested columnar storage and tree-based execution.
Modern Heirs
The same combination of columnar storage, compression, and distributed execution appears across every modern analytics ecosystem:
-
Google BigQuery. Petabyte-scale data warehouse.
-
Amazon Redshift. Cloud data warehouse.
-
Snowflake. Modern cloud analytics platform.
-
Apache Parquet. Open-source columnar file format.
-
ClickHouse. Real-time analytics database.
Takeaway: BigQuery stores compressed columns, reads only the required columns for a query, and distributes the scan across on-demand workers. PostgreSQL's row layout favors whole-record access, while BigQuery's columnar layout favors aggregations across a few fields.