Optional 6.3d · Lineage: What Broke, and What Will I Break?
Concept. The graph that 6.3c produced supports two traversals. Walk up from a wrong number to find the upstream transformation that introduced it. Walk down from a proposed change to find the models that depend on it. Model-level edges come from declared dependencies. Column-level edges require analysis of the SQL, because the SQL encodes which input columns feed which outputs.
Intuition. A number falls thirty percent overnight and it looks like good news. Every job ran green and every test passed. The number is still wrong, because a filter three models upstream stopped matching anything at all.
Six models, all green
A readmission rate is the share of patients who come back within thirty days of a visit. Hospitals are judged on it, so people watch it.
Last night it dropped thirty percent, which reads like a clinical win. Nothing in the pipeline failed.
That metric sits at the top of the stack 6.3c built. Underneath it are five models, each reading the one below it:
readmission_rate_30d      the published number
  fct_visits              the fact table it reads
    int_visit_costed      joins the parties, prices each visit
      int_visit_completed keeps only visits that ended
        stg_visit         cleaned, renamed encounters
          raw_encounter   landed as the source sent it
Every one of them built successfully. The break is three hops up, and it is one line:
-- int_visit_completed.sql
SELECT * FROM {{ ref('stg_visit') }}
WHERE status = 'finished'
FHIR revised its Encounter resource. In R4 a visit that had ended carried status = 'finished'. In R5 the value set changed, and the same visit now carries status = 'completed'. The sender upgraded, the filter kept matching a string nobody sends any more, and the model started returning zero rows.
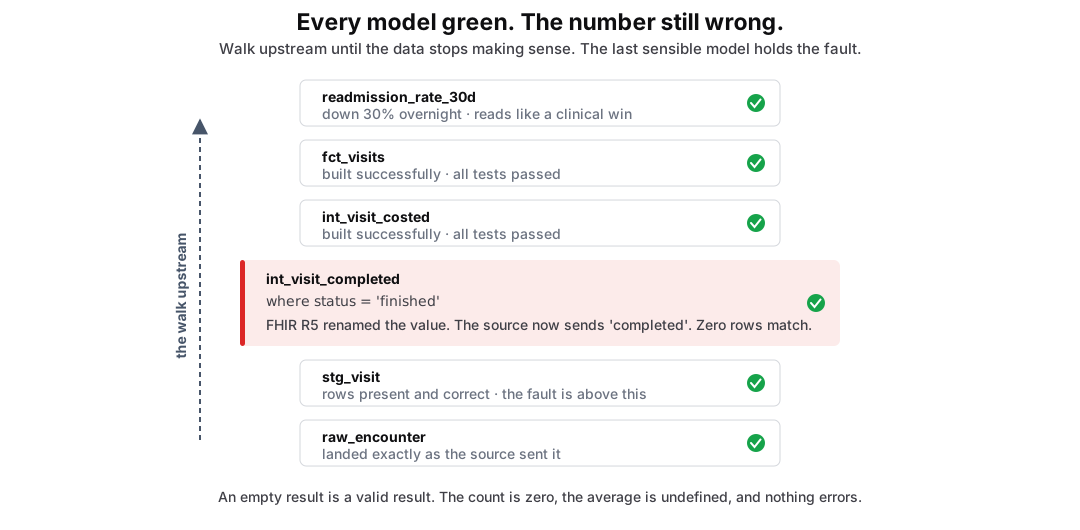 Figure: Every model green, the number still wrongSix models stacked from raw_encounter at the bottom to readmission_rate_30d at the top. Each carries a green tick because every model built successfully. An arrow walks upward from the metric through each model until it reaches int_visit_completed, marked in red, whose filter tests status equals finished while the source now sends status equals completed, so the model returns zero rows and everything above it computes on an empty set.
Figure 1. Every model is green and the number is still wrong. The walk starts at the symptom and moves upstream one edge at a time until the values stop making sense. It ends at int_visit_completed, whose filter tests a status value the source no longer sends. Nothing errored, because an empty result is a valid result: the count is zero, the average is undefined, and everything above it computes on nothing. This is the failure 6.4 calls schema drift, found by walking the graph.
No assertion would have caught this, because nobody tests that a filter still matches something. The search has a fixed shape: you walk edges upstream until the data stops being sensible, and the last sensible model holds the fault.
One graph, two directions
Reverse the walk and you have the other question. Before you rename a column, you want to know what depends on it: the same graph, the same traversal, pointed the other way. dbt exposes both by moving a single +:
dbt ls --select +fct_visits    # ancestors: what feeds this?
dbt ls --select fct_visits+    # descendants: what will I break?
dbt ls --select 2+fct_visits   # two hops upstream, no further
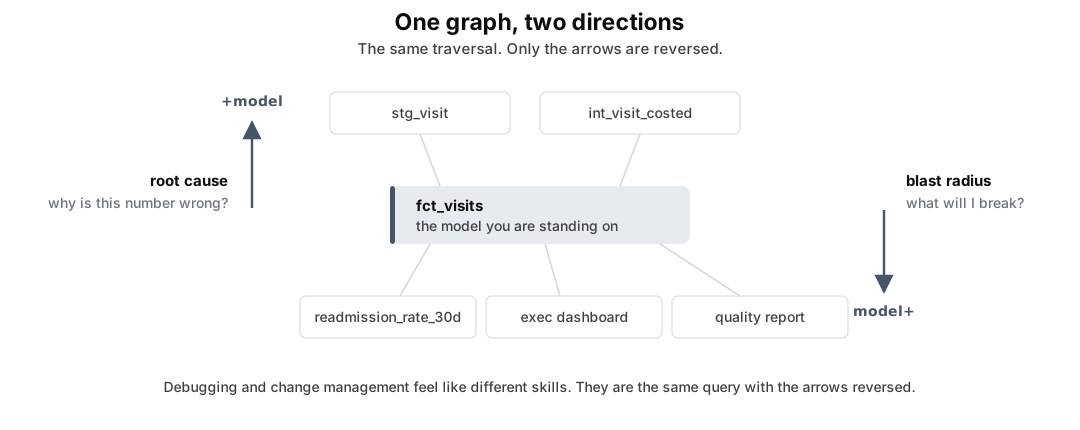 Figure: One graph, two directionsA single pipeline graph with one model highlighted in the centre. Above it sit its ancestors and below it sit its descendants. On the left, an upward arrow labelled plus model is titled root cause and asks why is this number wrong. On the right, a downward arrow labelled model plus is titled blast radius and asks what will I break. The same graph and the same traversal serve both, with only the arrow direction reversed.
Figure 2. One graph, one node, two directions. Walking to the ancestors answers why is this number wrong; walking to the descendants answers what will I break. Debugging and change management are the same query here, with the arrows reversed. Both run from a terminal against the graph you already have.
Model-level says 23. Column-level says 6.
Now make the change concrete. FHIR records a measurement as an Observation, which staging renamed to stg_measurement. Weight is arriving in both pounds and kilograms, so you want to split its value_quantity column into a number and a unit.
Ask model-level lineage what depends on stg_measurement and, on the pipeline 6.3c just built, it answers 23 models. That is true, and useless: it is half the warehouse, and it is the answer you get because the edge is model to model. Any model reading any column of stg_measurement is a descendant.
Ask column-level lineage what depends on that column and it answers 6, and it tells you what kind of dependency each one is.
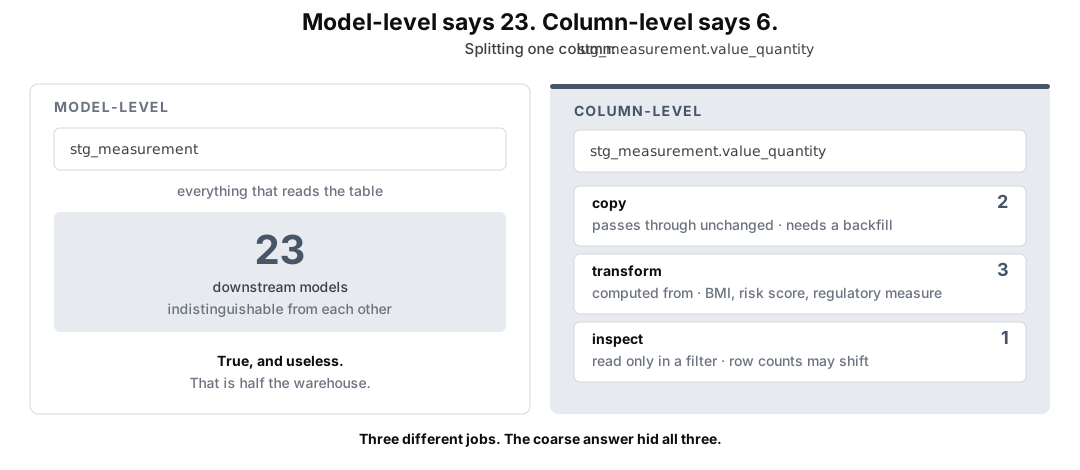 Figure: Model-level says 23. Column-level says 6.Two panels comparing lineage granularity for the same proposed change. The left panel, model-level, shows one source model with twenty-three downstream models drawn as an undifferentiated block, labelled true but useless. The right panel, column-level, shows the same source column with only six downstream models split into three kinds: two copy, which pass the value through and need backfilling, three transform, which compute from it so their numbers change, and one inspect, which reads it only in a filter so values are unchanged but row counts may shift.
Figure 3. The same change, asked at two granularities. Model-level lineage sees only that a model touched the table, so it reports the whole subtree. Column-level lineage classifies each dependency: copy passes the value straight through, so an export and a feature table need backfilling; transform computes from it, so a BMI calculation, a risk score and a regulatory measure all change their numbers; inspect only reads it in a WHERE or a JOIN, so values do not change but row counts might. Three different jobs, and the coarse answer hid all three.
A model that only inspects the column never reports a wrong number. It returns a different set of rows, which is the failure the first half of this page walked three hops to find.
Why the finer answer costs more
Model-level lineage is free because you declared it. You said this model reads that one, and the tool wrote it down. Counting upstream and downstream is then just following edges someone handed you.
Nobody declares column lineage. Which column feeds which is never stated anywhere: it is buried inside the SQL, in the expressions. A SELECT * has to be expanded to know what it even selected. A value gets summed three CTEs later under a different name. A join key changes which rows survive without changing a single value.
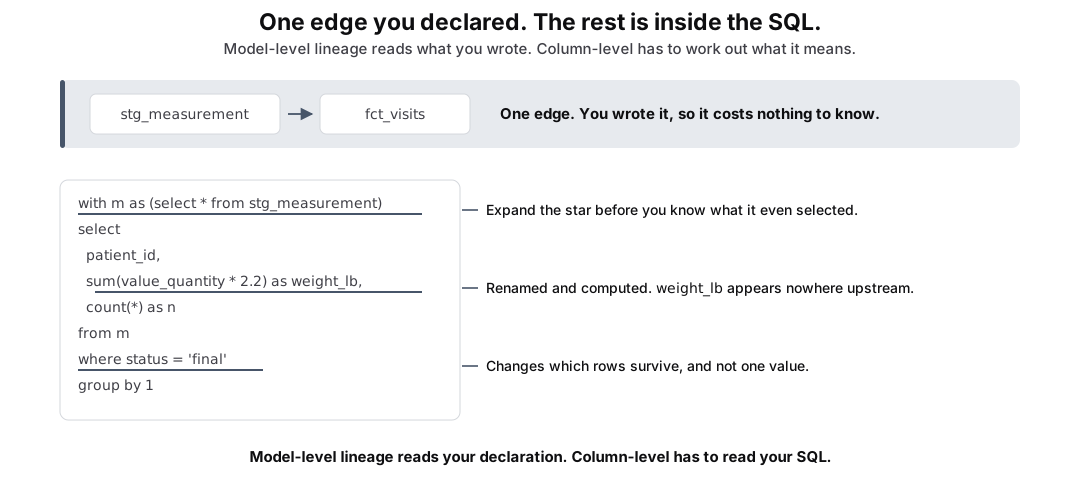 Figure: One edge you declared. The rest is inside the SQL.A band at the top shows the one edge you declared: stg_measurement feeding fct_visits, which costs nothing to know because you wrote it. Below, a short SQL query is annotated at three lines to show why column lineage is harder. The star in a select has to be expanded before anything knows what it selected. A summed and renamed expression produces weight_lb, a name that appears nowhere upstream. A where clause changes which rows survive without changing any value. A closing line notes that model-level lineage reads your declaration while column-level lineage has to read your SQL.
Figure 4. The one edge you declared, and the three reasons the rest is work. ref() gave the tool stg_measurement feeding fct_visits for free. Everything finer is buried in the query: the star has to be expanded before anything knows what it selected, weight_lb is a name that exists only in the output, and the WHERE changes which rows survive without touching a single value. Answering what depends on this column means resolving all three.
So to answer what depends on this column, something has to read the query the way the database reads it, and follow each output column back through every expression to the inputs it came from. That is the same tracing the optimizer did in Module 3C, run for a different reason: the optimizer traces the query to decide how to run it, and lineage traces it to decide what depends on what.
Model-level lineage reads your declarations. Column-level lineage has to understand your SQL. That is the whole of the price difference.
The agent walks it too
Without the graph, an agent asked what a change will break predicts a plausible answer, which for a question about your warehouse means inventing one. With the graph, it looks the answer up instead.
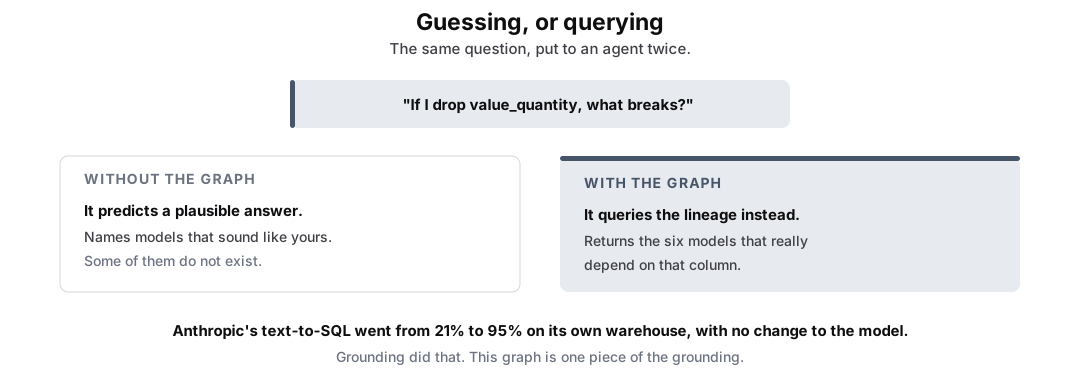 Figure: Guessing, or queryingOne question sits at the top: if I drop value_quantity, what breaks? Two panels below answer it. Without the graph, the model predicts a plausible answer, naming models that sound like yours, some of which do not exist. With the graph, the model queries the lineage instead and returns the six models that actually depend on that column. A closing note records that Anthropic's text-to-SQL accuracy went from twenty one percent to ninety five percent on its own warehouse with no change to the model, that grounding produced that gain, and that this graph is one piece of the grounding.
Figure 5. The same question asked twice. A model with no access to your warehouse can only produce something shaped like an answer, and a plausible list of model names is exactly the failure that is hardest to notice. With the graph the question stops being a prediction and becomes a lookup.
Case Study 1.1 reports 21% to 95% on Anthropic's own warehouse with no change to the model, all of it from grounding built around it. This graph is a piece of that grounding. The model did not get better; the map did.
Takeaway
Why is this number wrong? and what will I break? are one query, run in two directions, over a graph you got for free.
Model-level edges cost nothing because you declared them, and they answer the coarse question honestly. Column-level edges cost somebody understanding your SQL, and they are the difference between "23 things depend on this" and "three of them change a number, two need a backfill, and one will return different rows without erroring." Which answer you need depends on how far the change reaches.
Only the graph can answer either question.
Video
Play video: Optional 6.3d: Lineage, Root Cause & Blast Radius