CS145: Your Data Systems Journey
Master the core. Pick a technical path. Build your projects.
 Figure: CS145 career journey mapA left-to-right map. The two blue boxes are CS145 itself, the content in focus: the core curriculum with Project 1, then a Project 2 choice of the Science path or the Systems path, NanoMem. The grey box is what you keep learning beyond the course, out of focus here. The green box is where it leads, the careers the path opens. Color key: blue is CS145 content, green is where it leads, grey is beyond CS145.
| Core: SQL (+ Pandas, NoSQL) | Where it leads |
|---|---|
| BigQuery, tens of GB | Data Scientist |
| Storage, indexes, query opt | Build a search engine |
| ACID, then distributed: | Founder / CTO |
Figure 1. Core database skills build toward a project path, and each path maps to the industry roles that use it.
After CS145: Interview Questions You Can Answer
These representative interview questions use familiar company contexts. By the end of CS145, you can solve each one and handle the scale follow-up.
SQL & Analytics
Amazon · Top products query
Products with over $1M revenue in Q4 but under $100K in Q1.
Follow-up: optimize for a 10 TB orders table; which indexes?
Hints: orders(order_id, product_id, amount, date), products(product_id, name) · EXTRACT/QUARTER · GROUP BY with HAVING
Meta · Friend recommendations
Friends-of-friends but not direct friends, ranked by mutual friend count.
Follow-up: 30 s on 1M users; optimize for 500M.
Hints: friendships(user1_id, user2_id) bidirectional · self-joins · COUNT DISTINCT · LEFT JOIN with NULL check
Netflix · Binge-watching detection
Users who watched over 3 episodes of one show in any 24-hour window.
Follow-up: episodes across midnight, or across time zones?
Hints: views(user_id, show_id, episode_id, timestamp) · window functions (LAG / LEAD) · timestamp diffs
Systems Design
Google · URL deduplication
Check if a URL was crawled before. Handle 100B URLs.
Follow-up: normalization: www vs non-www, http vs https, trailing slash.
Hints: 100B × 100 bytes = 10 TB (no fit in memory) · Bloom filters (1% false positive ok) · distributed hash tables
Uber · Distributed event counter
Real-time ride counter across 5 data centers. Under 1 s lag, 99.99% uptime.
Follow-up: accuracy or availability during a network partition? Why?
Hints: partitions between DCs · eventually consistent counters · CRDTs · write-through cache
You'll read, debug, and write queries like this
Example: Finding Power Users
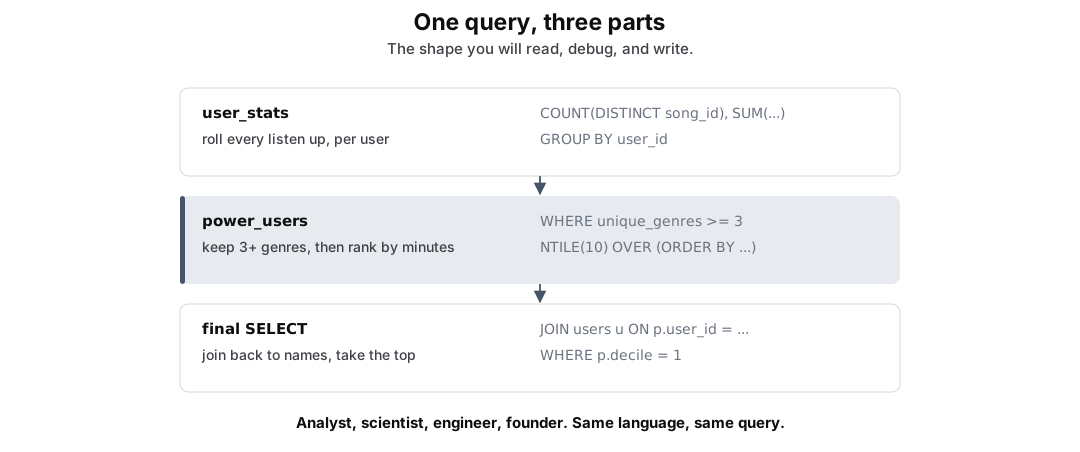 Figure: One query, three partsThe power-users query has three parts. The first CTE counts distinct songs, distinct genres, and total listens per user. The second keeps users spanning at least three genres and ranks them into deciles by total listens. The final SELECT joins user names and returns the top decile.
Figure 2. A production SQL pattern: two CTEs compute per-user aggregates and a decile rank, then an outer SELECT joins names and filters to the top decile.
WITH user_stats AS (
  SELECT
    l.user_id,
    COUNT(DISTINCT l.song_id) AS unique_songs,
    COUNT(DISTINCT s.genre) AS unique_genres,
    COUNT(*) AS total_listens
  FROM Listens AS l
  JOIN Songs AS s ON l.song_id = s.song_id
  GROUP BY l.user_id
),
power_users AS (
  SELECT
    user_id,
    unique_songs,
    unique_genres,
    total_listens,
    NTILE(10) OVER (ORDER BY total_listens DESC) AS decile
  FROM user_stats
  WHERE unique_genres >= 3
)
SELECT
  u.name,
  p.unique_songs,
  p.unique_genres,
  p.total_listens
FROM power_users AS p
JOIN Users AS u ON p.user_id = u.user_id
WHERE p.decile = 1
ORDER BY p.total_listens DESC;
From an event to an analytical result
Spotify's published data platform
Spotify's clients publish typed events into an event-delivery system. Its data platform provisions queues, anonymization pipelines, and streaming jobs. Scheduled workflows run in BigQuery, Flink, or Dataflow.
 Figure: Spotify: from a client event to analysisThree panels show Spotify's published data-platform path. Client software publishes typed events. Event delivery uses managed queues, anonymization pipelines, and streaming jobs. Scheduled workflows run in BigQuery, Flink, or Dataflow so teams can analyze the resulting data. Color key: blue is collection, grey is movement and processing, green is analysis.
Figure 3. Spotify's published data platform collects typed client events, moves them through managed queues and processing jobs, and makes the resulting data available for analysis.